Lab 03 : Segmentation using thresholding and morphology
Cell segmentation

Segmentation is the task of describing image areas by some context information, like finding cells in microscopy images. We want to construct an automated detection procedure, that will take an input image and through a series of steps retrieves the objects of interest in the image.
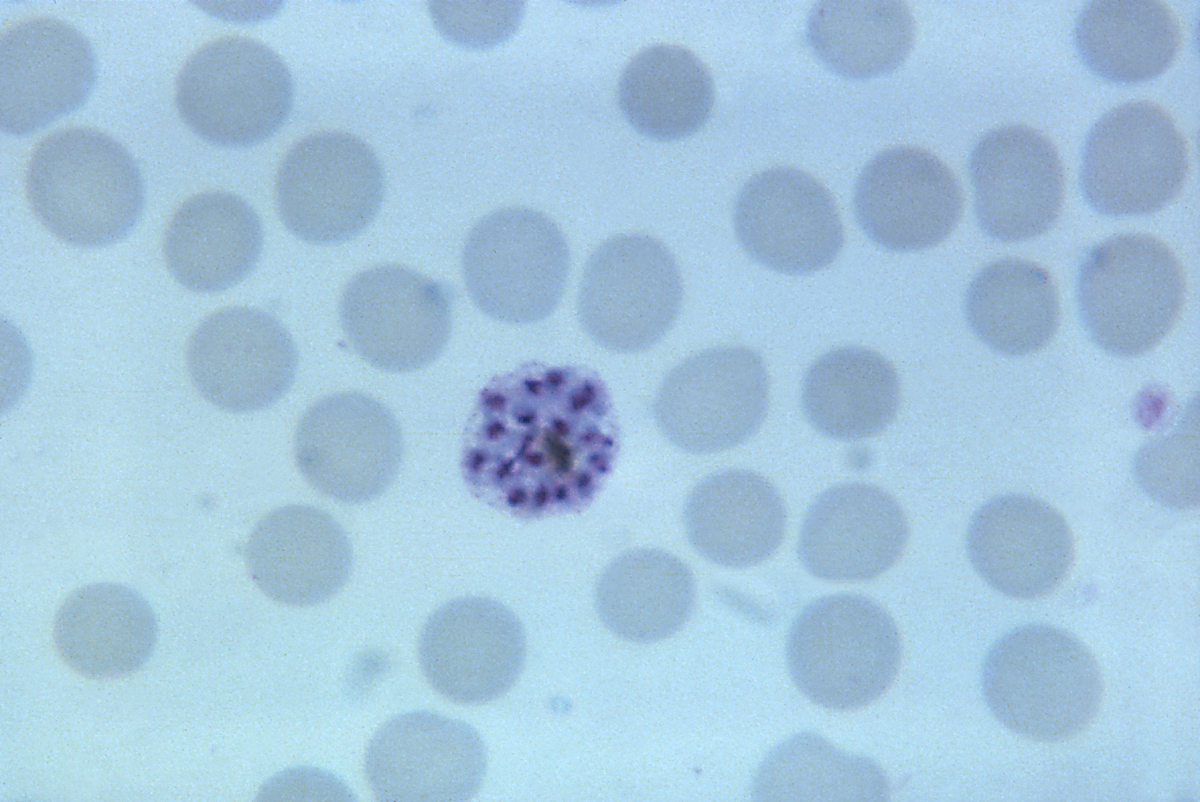
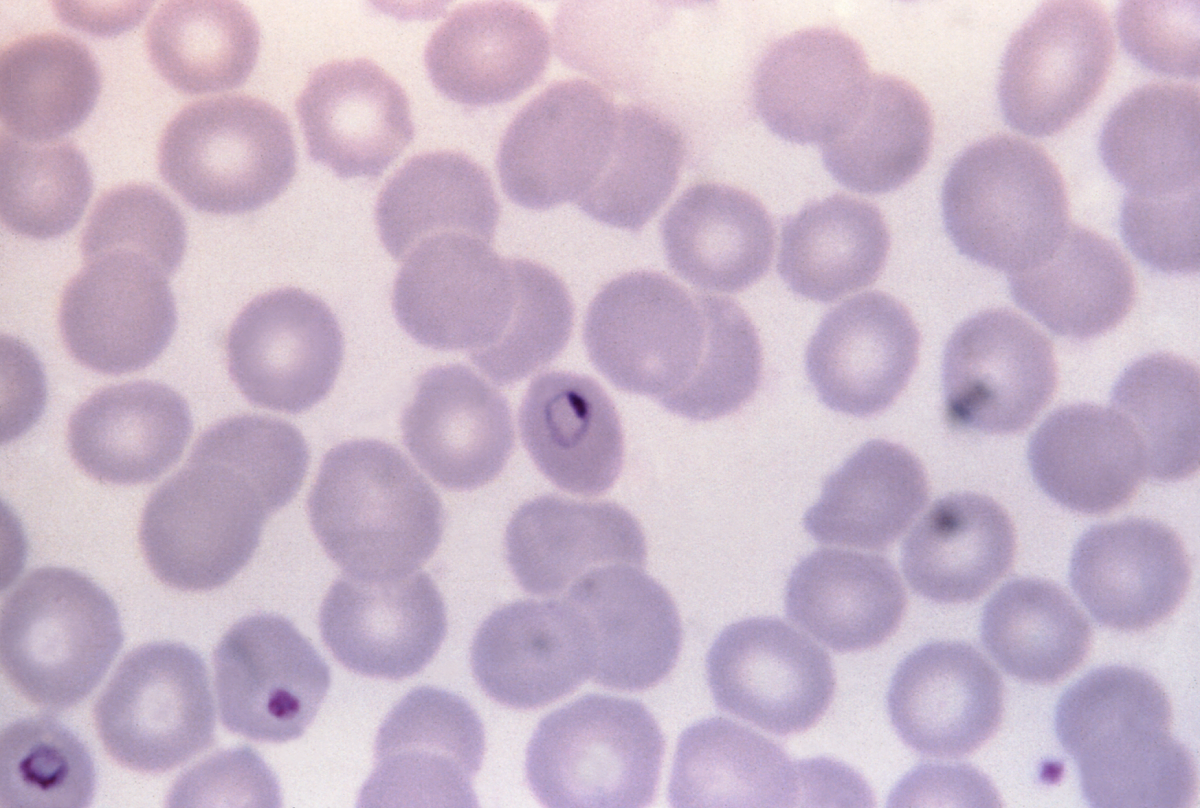
In this lab we will attempt to segment the red blood cells in a microscopy image (such as the topmost image in the figure on the right).
1 Thresholding
A cell is typically a roundish dark object, so we first need to separate cell-like pixels from background and other structures by thresholding with a suitable threshold level.
After reading (imread) and converting to grayscale image rgb2gray,
I = imread('5830.png');
Ig = rgb2gray(I);
figure;
imshow(I,[],'InitialMagnification','fit');
we can play around and try to find a suitable threshold by trial and error (as in the first lab) or we can attempt to find optimal threshold by using the Otsu's method implemented in the function graythresh in Matlab:
level = graythresh(I_gray);
Ibw = im2bw(I_gray, level);
- If the automatic thresholding fails, we may need to set the threshold
levelmanually. - To select the threshold level manually, a look at the histogram can be useful (as below)
[pixelCount grayLevels] = imhist(I_gray);
bar(pixelCount);
- Image filtering like imgaussfilt prior to thresholding may give us better result.
2 Morphology
Binary morphology filters and filling holes may help reduce artifacts in the binarized image. Check out functions such as imerode, imdilate, imopen and imclose.
After the binary filtering we want to further filter the detected objects according to their properties. The function regionprops can be used to devise various useful properties of the isolated (connected) areas in the binarized image.
[B, L] = bwboundaries(Ibw, 'noholes');
stats = regionprops('table',L,'Area');
- we can specify multiple measures in regionprops as
Areamay not be sufficient to distinguish between false and true detection. ConsiderEccentricityandSoliditymeasures. TheEccentricityis the measure how much eccentric the binary object is and an ellipse whose eccentricity is 0 is actually a circle, while an ellipse whose eccentricity is 1 is a line segment. TheSoliditymeasures the raggedness of the object boundary. It is the proportion of the pixels in the convex hull (a convex region encapsulating the binary object) that are also in the binary object. Values close to 1 indicate a convex objects, while smaller values indicate that there are indentations (concavities) in the object boundary. - to view labels as a colored image, use
imshow(label2rgb(L, @jet, [.5 .5 .5]))
- (optional) if multiple cells are labeled as one blob, a watershed filter can sometimes separate them.
% Watershed - first compute distances for each pixel to the boundary
% but since bwdist computes distances to non-zero pixels, we need to
% logicaly revert the segmentation (~Ibw)
D = bwdist(~Ibw);

% If the watershed produces too many splits, try to smooth the distance image
D = imgaussfilt(-D, 1.5);
% Set distance to Infinity for places, where our binary image is zero
D(~Ibw) = Inf;

% Get labels by watershed transform
Lw = watershed(D, 8);
Lw(~Ibw) = 0;
Finally, we want to filter the detected regions by the retrieved measures and for the correct ones plot their boundary in the original input image I
imshow(I);
hold on
for k = 1:length(B)
    if stats.Area(k) > ??
        boundary = B{k};
        plot(boundary(:,2), boundary(:,1), 'y', 'LineWidth', 2)
    end
end
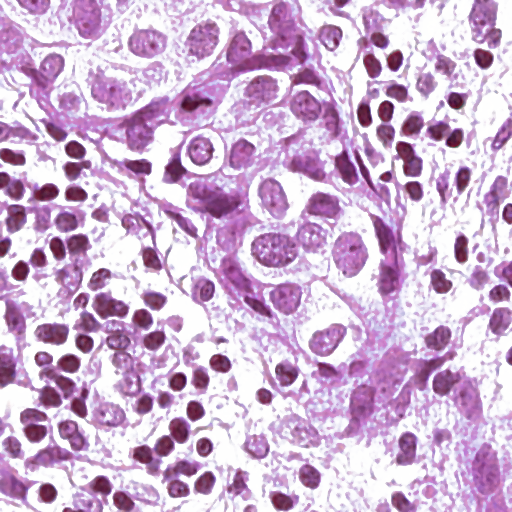
Homework [5pt] Find suitable criterion on region properties (like Area, Solidity etc.) to select cell-regions for each of the following data: 5140.png, 5830.png, histopato1.png, histopato2.png. In the report from this lab, for each input image report the procedure you chose for the cell segmentation and all the parameters. Add images indicating the resulting segmentation. Comment on the results