Table of Contents
Ultrasound
Prerequisites
- A snapshot of a bone of your choice, taken with an ultrasound.
- Two sequences of images of the carotid artery, taken with an ultrasound. One taken along the artery and another taken across. Two additional general sequences are provided, so in total there should be four sequences to run the task.
Task
- Report the thickness of a bone of your choice, measured during acquisition. (0.5pt)
- Measure the heart rate of the acquired image sequences (procedure below).
Procedure for the second task
Repeat the procedure for all image sequences – the same code has to work for all sequences (only cropped regions can be different). Report all found frequencies in a table. Two of the sequences must be acquired by each group, the remaining two sequences are available here and here. Consider the frame rate of the image sequences 30 fps.
- Crop a region of interest around the carotid artery from the video (unless already cropped). Calculate the mean brightness $j(t)$ for each frame $t$, of the entire region of interest and plot $j(t)$. (0.5pt)

- Smooth the signal $j(t)$ by measuring the mean value over a window of size $w$ (for instance $w = 36$). (optional)
- Calculate the heart rate (the dominant frequency of $j(t)$, in beats per minute (bpm)) with the following techniques and compare results.
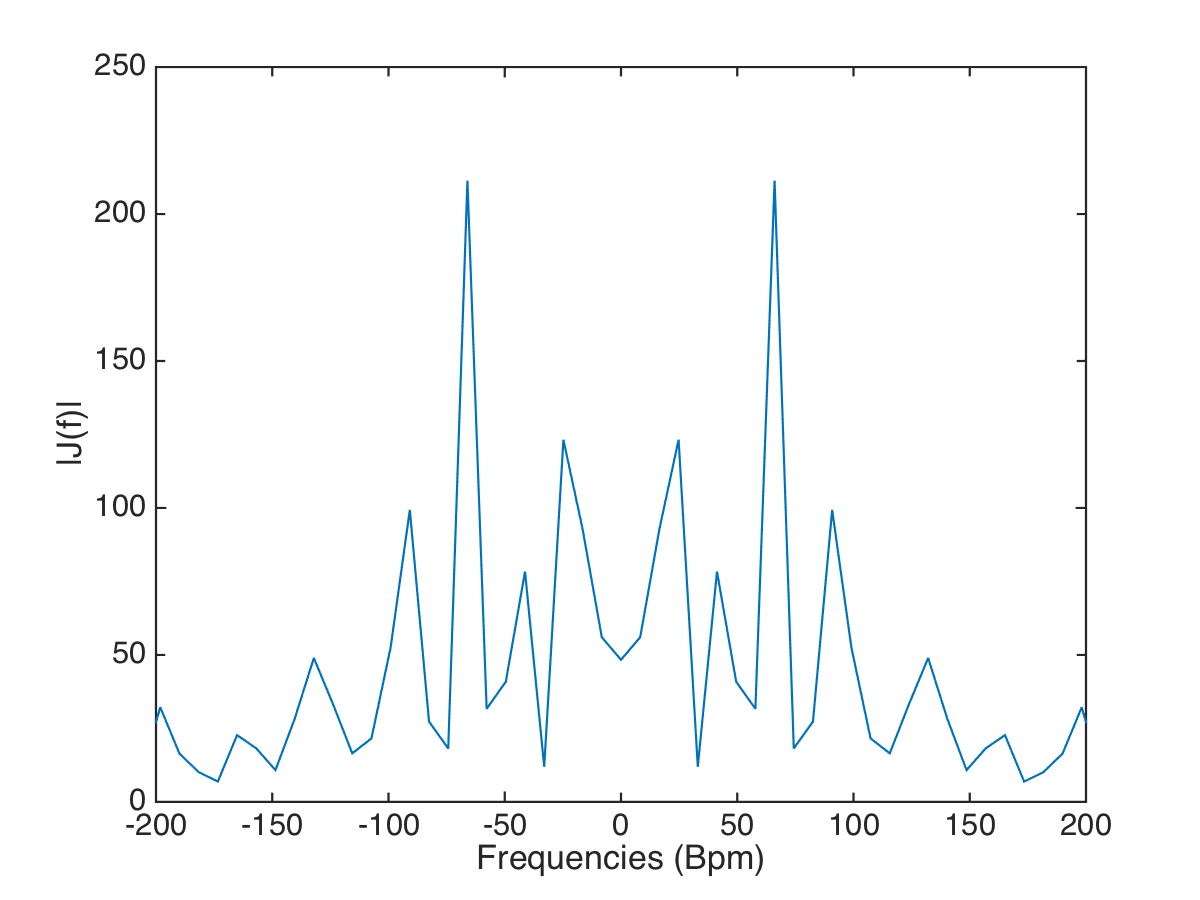
- Fourier Transform (2pt)
- Use the MATLAB function fft and obtain the power spectrum $J(f) = |\mathcal{F}(j)|$ (get the absolute value of the FFT).
- Apply the function fftshift to $J(f)$ to get the vector in the order $-\frac{f_r}{2} \leq f \leq \frac{f_r}{2}$, where $f_r$ is the frame rate of the video, or eliminate the negative frequencies (second half of the vector).
- Find the dominant frequency above 50bpm and express it in bpm.
- Display $J(f)$ with the correct units (bpm) on the frequency axis.
- Autocorrelation (2pt)
- Calculate a filtered signal $j_h(t) = j(t) - j(t) \ast h$, where $h$ is a Gaussian filter with $\sigma=5s$ to eliminate low frequencies (use the function conv to do the convolution). Remember that a Gaussian filter can be obtained by $$g(x) = \frac{1}{\sqrt{2 \pi} ~ \sigma} e^{-\frac{x^2}{2 \sigma^2}}$$Remember as well to normalize the filter.
- Use the MATLAB function xcorr to calculate the autocorrelation of $j_h(t)$.
- Calculate the period of the signal from the autocorrelation using the peaks closest to zero (use the function findpeaks) and report the frequency in bpm.

- BONUS: Find the pixels which fit to a sinusoidal signal model $s(x,t) = a(x) $sin$(2\pi f_h t) + b(x)$cos$(2\pi f_h t) + c(x)$, where $x$ is a pixel, $t$ a frame and $f_h$ the frequency (be careful with the units – you need to take the frame rate into account) obtained in the previous steps. (bonus 1pt)
- Find for each pixel $a(x), b(x)$ and $c(x)$. This can be solved by solving a system of linear equations
<latex>
\begin{bmatrix}
s(x,1) \\
\vdots \\
s(x,N)
\end{bmatrix} = \begin{bmatrix}
\textrm{sin}(2\pi f_h t_1) & \textrm{cos}(2\pi f_h t_1) & 1 \\
\vdots  & \vdots  & \vdots \\
\textrm{sin}(2\pi f_h t_N) & \textrm{cos}(2\pi f_h t_N) & 1
\end{bmatrix} \begin{bmatrix}
a \\
b \\
c
\end{bmatrix} \quad (![]() \quad S = A.V
</latex>
\quad S = A.V
</latex>
- Use the operation \ (mldivide) in MATLAB, to obtain $V$.
- Calculate for each pixel $a(x)^2 + b(x)^2$.
- Find which pixels have $a(x)^2 + b(x)^2 > \tau$, for a threshold $\tau$ (e.g. $\tau = 50$).