Table of Contents
Lab 01 : Introduction / MATLAB
Topics:
- Lab organization, assessment requirements
- Homework assignment, upload, written report good practice
- MATLAB introduction
HW01 Assignment
For the homework, HW01 follow the emphasized links to get to the detailed description.
- [5 pts] - (A) MATLAB Introduction, go through a tutorial, if needed and complete the three tasks specified in the detailed description.
Upload your report in PDF format to BRUTE to the assignment L01-Matlab introduction. Please name the PDF file as hw02_<your_fel_id>.pdf. Zip both the MATLAB code and pdf report in a single file and upload to Brute.
MATLAB Introduction
Please make yourself familiar with MATLAB commands, use one of the available tutorials. You can also work with Python, consider using the packages scipy and matplotlib.
Homework tasks(2.5 points each)
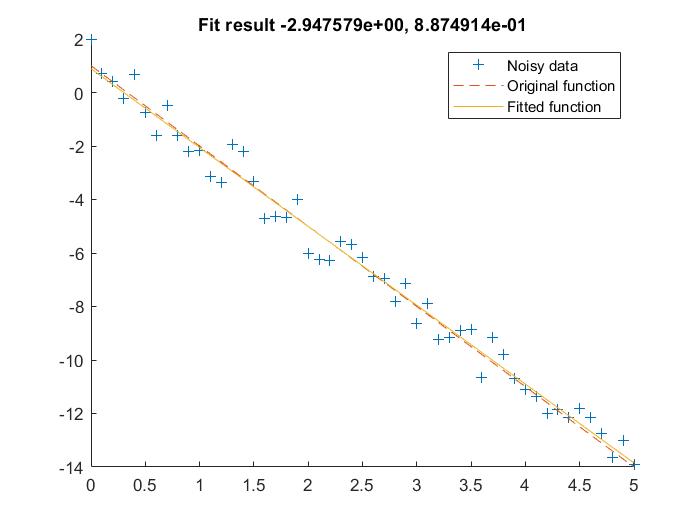
Create a 1D signal of the function $y = -3 \cdot x + 1$ over the range [0, 5] with step 0.1. Add uniformly or normally distributed noise within the range [-1, 1] to the signal. Plot the signal as blue circles. Plot also the original line without noise.
- Use linear least squares to fit a line to the noisy observations. The MATLAB function is mldivide. If we have a system of type $XA = Y $, where $A$ has size $2\times 1 $ contains the line coefficients [slope; intercept] (to be evaluated) and $X$ has size $51\times2$, the with first columns correspond to $x \in [0, 5]$ (51 values) and second column with intercepts 1, $Y$ has size $51\times1$ containing noisy $y$ values. The solution to the fit is $A = X \backslash Y$. Add a plot of the fitted line to the figure, show its coefficients in the title (sprintf). The resulting figure will look like the following and you can compare your results with the displayed (they should be similar if not the same)
- Plot a 2D surface of some function, for example
- $z = \frac{\sin(\sqrt(x^2 + y^2))}{\sqrt(x^2 + y^2))}$ for $x, y \in (-15, 15)$.
- $z = \sin(5*x) + \cos(4*y)$ for $x, y \in (-3, 3)$.
- function of your own choice
Use appropriate spacing of the grid to get a nicely-looking plot, like in the example below:
Hints
To add multiple plots to a single figure, use hold on. To then have legend for each of the single plots, get the handle for each(the return values ps and po) and specify the legend manually, as shown in the following snippet:
figure;
ps = scatter(xc, Y, 'b+');
hold on;
po = plot(xc, A * x, 'b');
legend([ps, po], {'Noisy data','Original'});

