Table of Contents
Lab 01 : Introduction / MATLAB
Topics:
- Lab organization, assessment requirements
- Homework assignment, upload, written report good practice
- MATLAB introduction
- Simple cell segmentation
- Count the total number of cells and mean size
HW01 Assignment
Homework HW01 has two sub-tasks, follow the emphasized links to get to the detailed description.
- [2 pts] - (A) MATLAB Introduction, go through a tutorial, if needed and complete the three tasks specified in the detailed description.
- [3 pts] - (B) Cell segmentation, build an image processing pipeline for cell segmentation in microscopy images (see detailed description).
Upload your report in PDF format to BRUTE to the assignment L01-matlab. Please name the PDF file as hw01_<your_fel_id>.pdf. Include the MATLAB code snippets in the report or upload them separately.
(A) MATLAB Introduction
Please make yourself familiar with MATLAB commands, use one of the available tutorials. You can also work with Python, consider using the packages scipy and matplotlib.
Homework tasks
- Create a 1D signal of the function $y = -3 \cdot x + 1$ over the range [0, 5] with step 0.1. Add uniformly or normally distributed noise within the range [-1, 1] to the signal. Plot the signal as blue circles. Plot also the original line without noise.
- Use linear least squares to fit a line to the noisy observations. The MATLAB function is mldivide. If we have a system of type $Y = A \cdot X$, where $A$ contains the line coefficients [-3; 1] in our case, then the solution to the fit is $B = X \backslash Y$. Add a plot of the fitted line to the figure, show its coefficients in the title (sprintf). The resulting figure will look like the following:

- Plot a 2D surface of some function, for example
- $z = \frac{\sin(\sqrt(x^2 + y^2))}{\sqrt(x^2 + y^2))}$ for $x, y \in (-15, 15)$.
- $z = \sin(5*x) + \cos(4*y)$ for $x, y \in (-3, 3)$.
- function of your own choice
Use appropriate spacing of the grid to get a nicely-looking plot, like in the example below:

Hints
To add multiple plots to a single figure, use hold on. To then have legend for each of the single plots, get the handle for each(the return values ps and po) and specify the legend manually, as shown in the following snippet:
figure;
ps = scatter(xc, Y, 'b+');
hold on;
po = plot(xc, A * x, 'b');
legend([ps, po], {'Noisy data','Original'});
(B) Cell segmentation

Segmentation is the task of describing image areas by some context information, like finding cells in microscopy images. We want to construct an automated detection procedure. A cell is typically a roundish dark object, so we first need to separate cell-like pixels from background and other structures by thresholding with a suitable threshold level. After reading (imopen) and converting to grayscale image rgb2gray,
I = imread('5830.png');
Ig = rgb2gray(I);
figure;
imshow(I,[],'InitialMagnification','fit');
we can attempt to find optimal threshold via
level = graythresh(I_gray);
Ibw = im2bw(I_gray, level);
- If the automatic thresholding fails, we may need to set the threshold
levelmanually. - Image filtering like imgaussfilt prior to thresholding may give us better result.
- Binary morphology filters and filling holes may help reduce artifacts in the binarized image.
- To select the threshold level manually, a look at the histogram can be useful (as below)
[pixelCount grayLevels] = imhist(I_gray);
bar(pixelCount);
We then search isolated (connected) areas in the binarized image and use regionprops to retrieve properties of each region:
[B, L] = bwboundaries(Ibw, 'noholes');
stats = regionprops('table',L,'Area');
- we can specify multiple measures in regionprops as
Areamay not be sufficient to distinguish between false and true detection. ConsiderEccentricityandSoliditymeasures - to view labels as a colored image, use
imshow(label2rgb(L, @jet, [.5 .5 .5]))
- (optional) if multiple cells are labeled as one blob, awatershed filter can sometimes separate them.
% Watershed - first compute distances for each pixel to the boundary
% but since bwdist computes distances to non-zero pixels, we need to
% logicaly revert the segmentation (~Ibw)
D = bwdist(~Ibw);

% If the watershed produces too many splits, try to smooth the distance image
D = imgaussfilt(-D, 1.5);
% Set distance to Infinity for places, where our binary image is zero
D(~Ibw) = Inf;

% Get labels by watershed transform
Lw = watershed(D, 8);
Lw(~Ibw) = 0;
Finally, we want to filter the detected regions by the retrieved measures and for the correct ones plot their boundary in the original input image I
imshow(I);
hold on
for k = 1:length(B)
    if stats.Area(k) > ??
        boundary = B{k};
        plot(boundary(:,2), boundary(:,1), 'y', 'LineWidth', 2)
    end
end
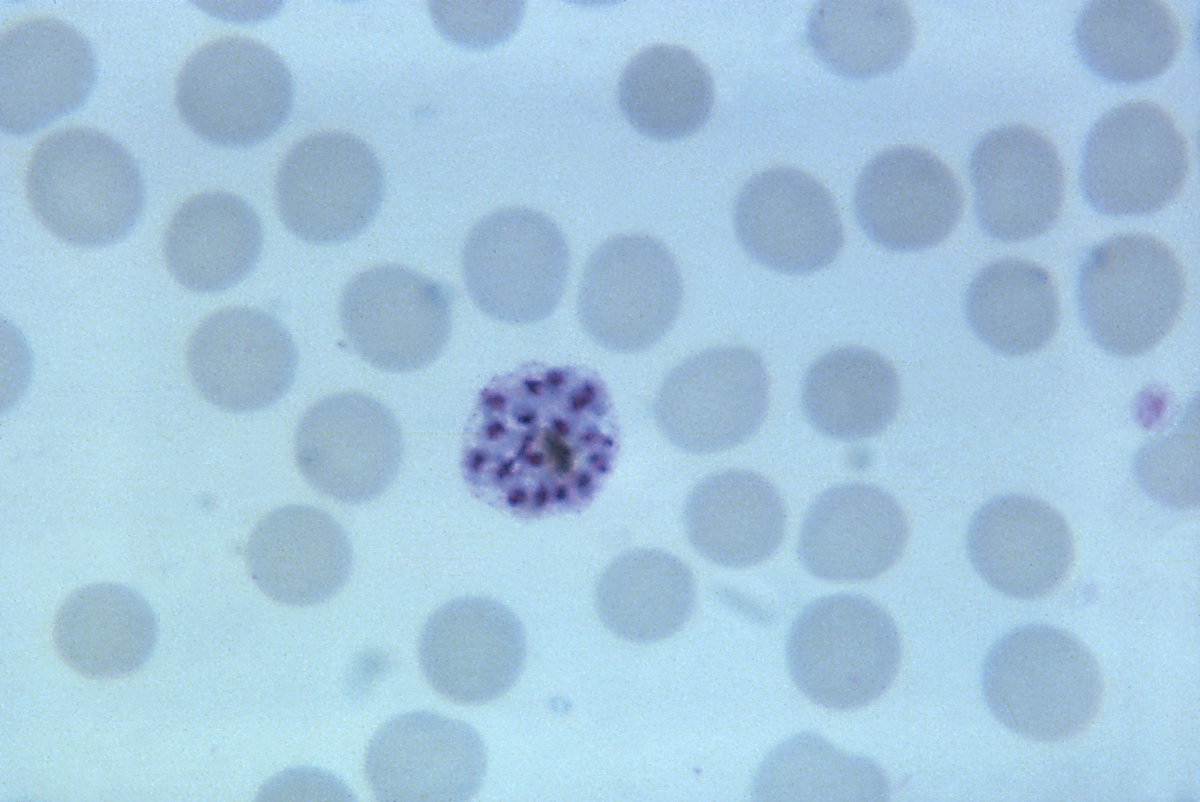
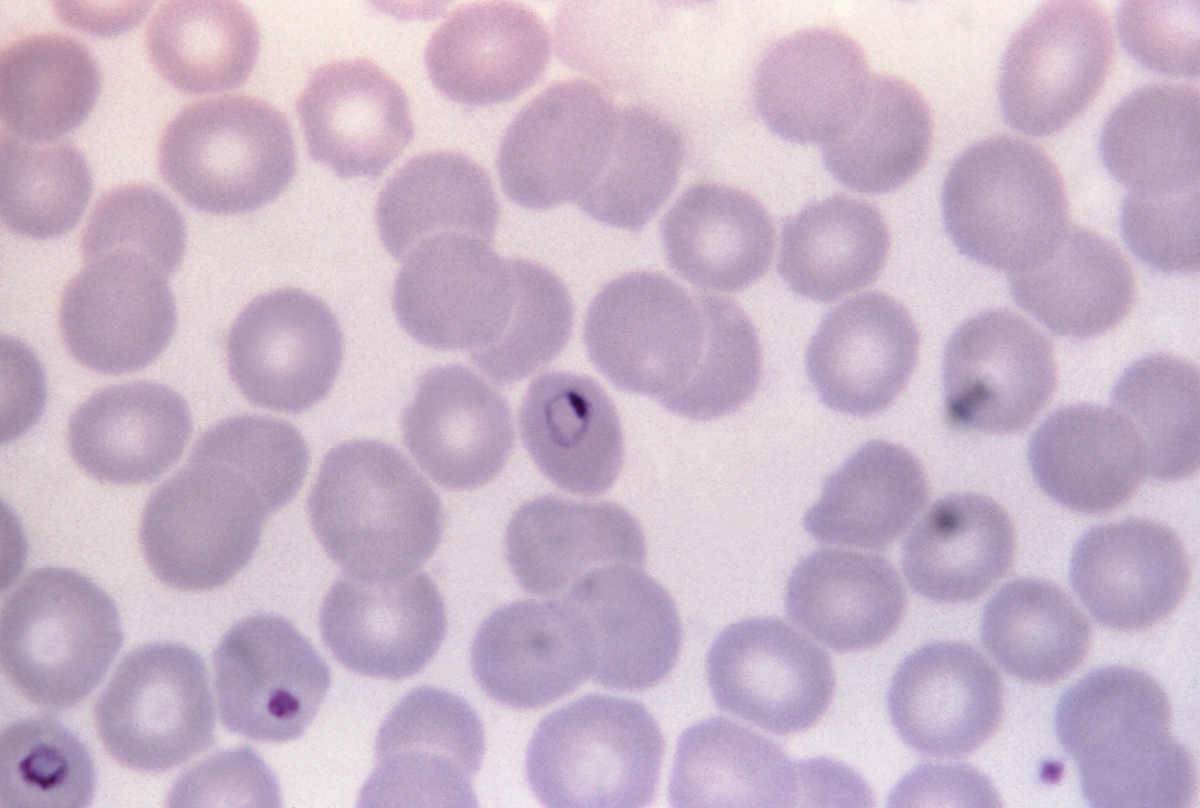
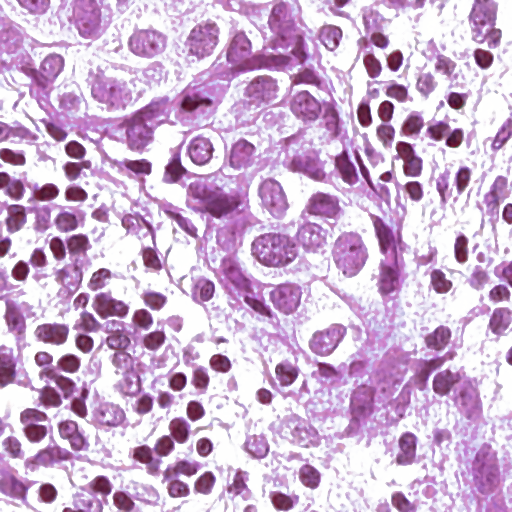
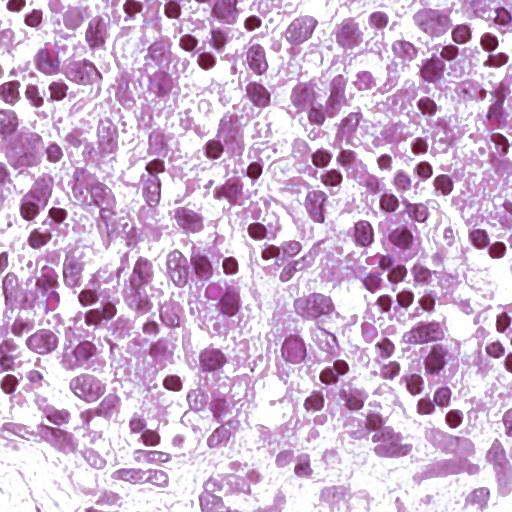
Task Find suitable criterion on region properties (like Area, Solidity etc.) to select cell-regions for each of the following data: 5140.png 5830.png histopato1.png histopato2.png
(C) Some useful commands
help, rand, meshgrid, surf, imread, rgb2gray, imshow, lookfor, edit, path, addpath, format,
end, reshape, inf, nan, isempty, floor, ceil, round, abs, sign, ops,
length, linspace, sort, det, rank, load, save, fprintf, axis, title,
contour, mesh, surf, colormap, print, for, if, while, function
Plot the resulting segmentation as boundary contour over the original image, like shown in the last picture.
MATLAB Help
- documentation of useful MATLAB functions: properties of labeled regions, gaussian filtering, binary morphology,watershed filter, filling holes
Python Help
- use the OpenCV library for image processing tasks. There are nice tutorials that cover many topics of image processing, including